CNV Profile Task Example
This tutorial shows how to run the cnv_profile evaluation task.
It uses HCC-2T as the example dataset.
Data Source And Assumptions
The HCC example is based on data from GSA-Human accession HRA000437.
In practice, raw FASTQ files are first processed with our standard upstream data workflow, and the resulting ST-CNVBench-ready inputs are then used for prep, run, and eval.
In this tutorial, we assume:
- your
data.yamlcontains one dataset entry withdataset_id: HCC-2T - the standardized input package is already available for that dataset
- your
models.yamlalready configures all CNV inference methods included in this benchmark - your
eval.yamlfollows the same parameter structure asconfigs/templates/eval.template.yaml
For detailed config requirements, see Dataset Preparation, Model Run, and Evaluation.
Step 1: Prepare Data
Run:
st-cnvbench --steps prep \
  --data-config data.yaml \
  --prep-ids HCC-2T
Check the prepared dataset under:
<output.root>/
Expected standardized outputs include:
filtered_feature_bc_matrix/filtered_feature_bc_matrix.h5adspatial/tissue_positions.csvspatial/scalefactors_json.json
Step 2: Run Models
Run all CNV inference methods configured for the benchmark:
st-cnvbench --steps run \
  --data-config data.yaml \
  --model-config models.yaml \
  --prep-ids HCC-2T \
  --exec-mode conda
Check raw model outputs under:
<results_dir>/HCC-2T/<model_name>/
Step 3: Evaluate CNV Profile
Run cnv_profile evaluation across all configured methods:
st-cnvbench --steps eval \
  --data-config data.yaml \
  --eval-config eval.yaml \
  --prep-ids HCC-2T \
  --eval-tasks cnv_profile
Check evaluation outputs under:
<eval_dir>/HCC-2T/cnv_profile/
Typical outputs include:
- CNV profile metrics summary tables
- per-method CNV profile comparison plots
- karyogram-level comparison plots
Example Results
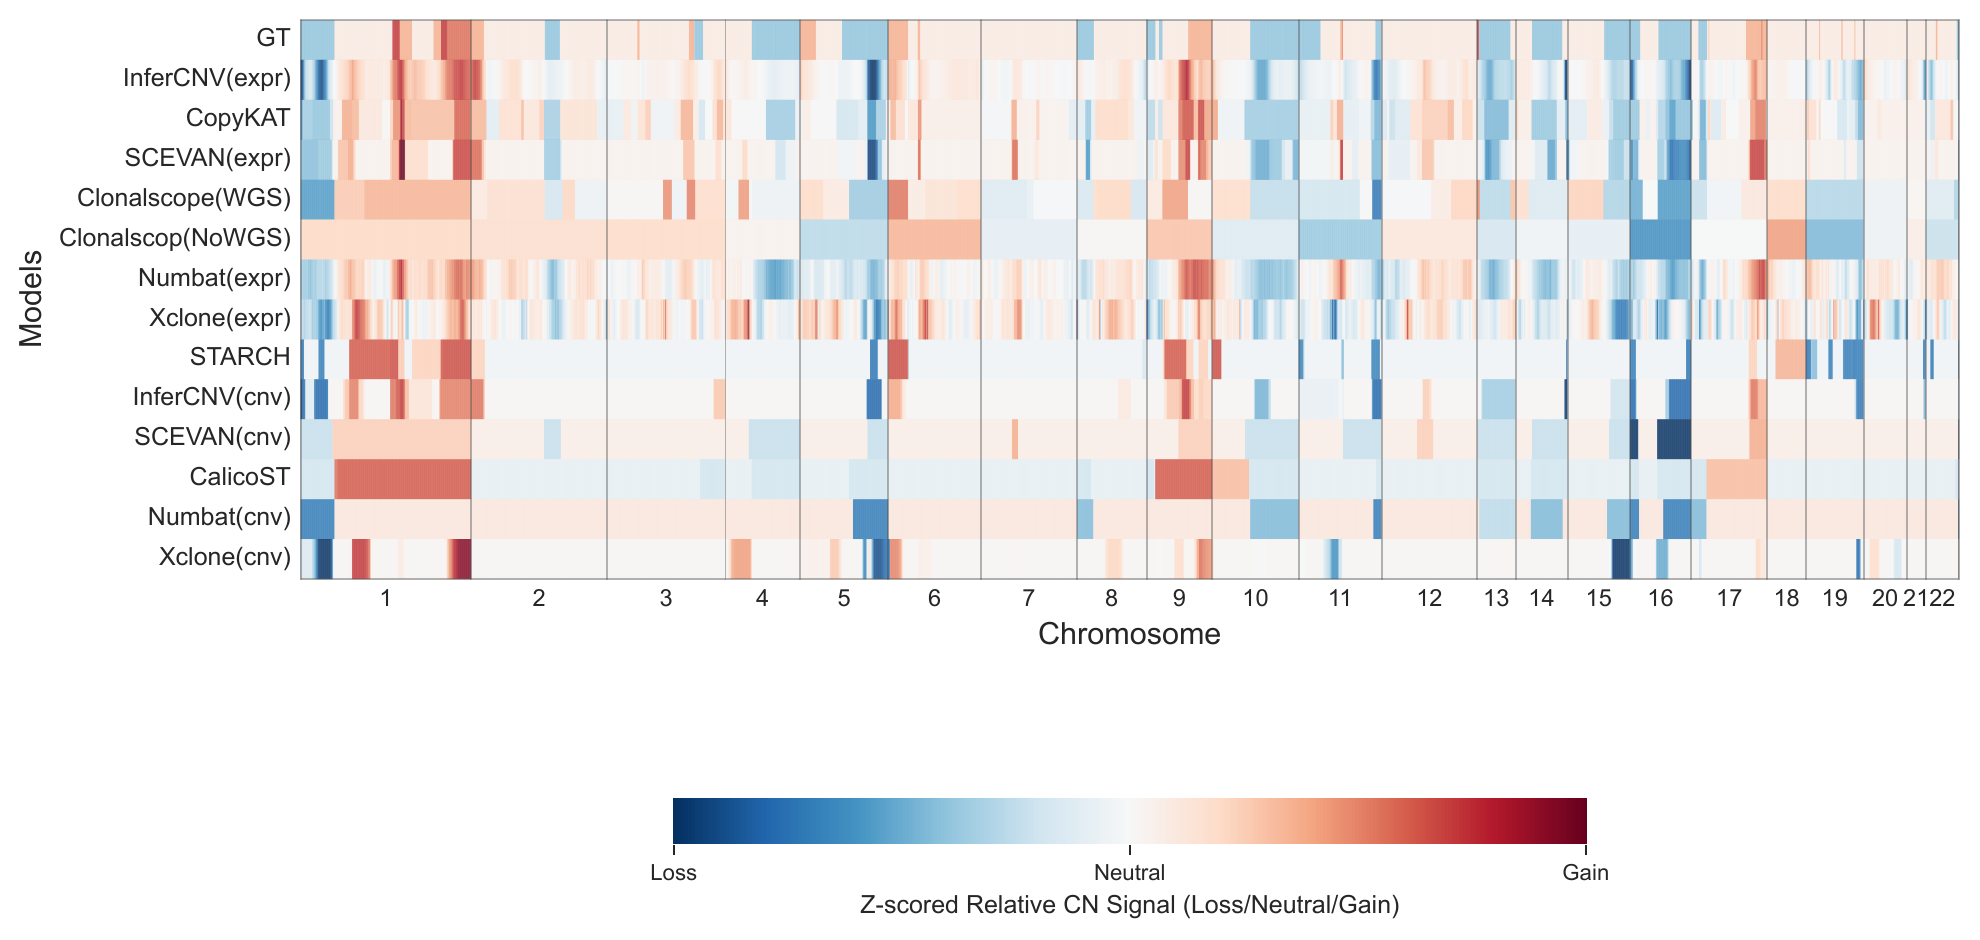
Copy Number Karyogram
This figure shows the copy-number profile karyogram across all methods.
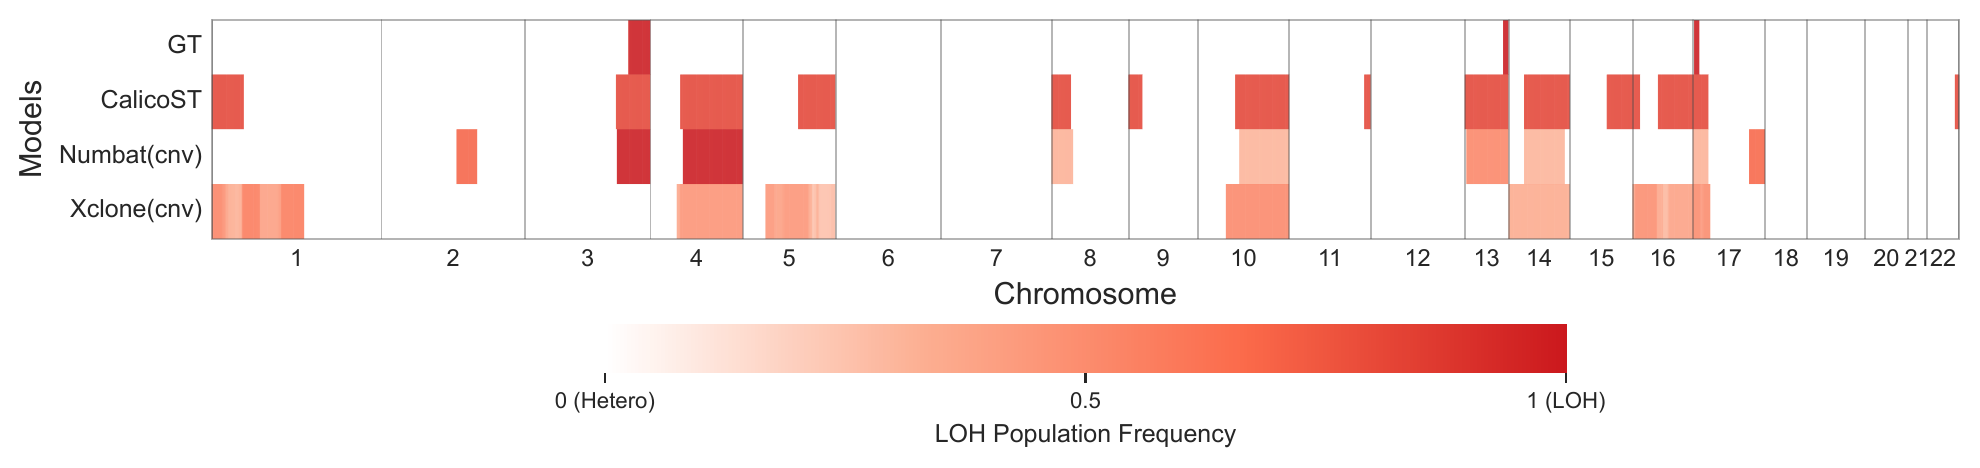
LOH Karyogram
This figure shows the LOH-status karyogram across all methods.
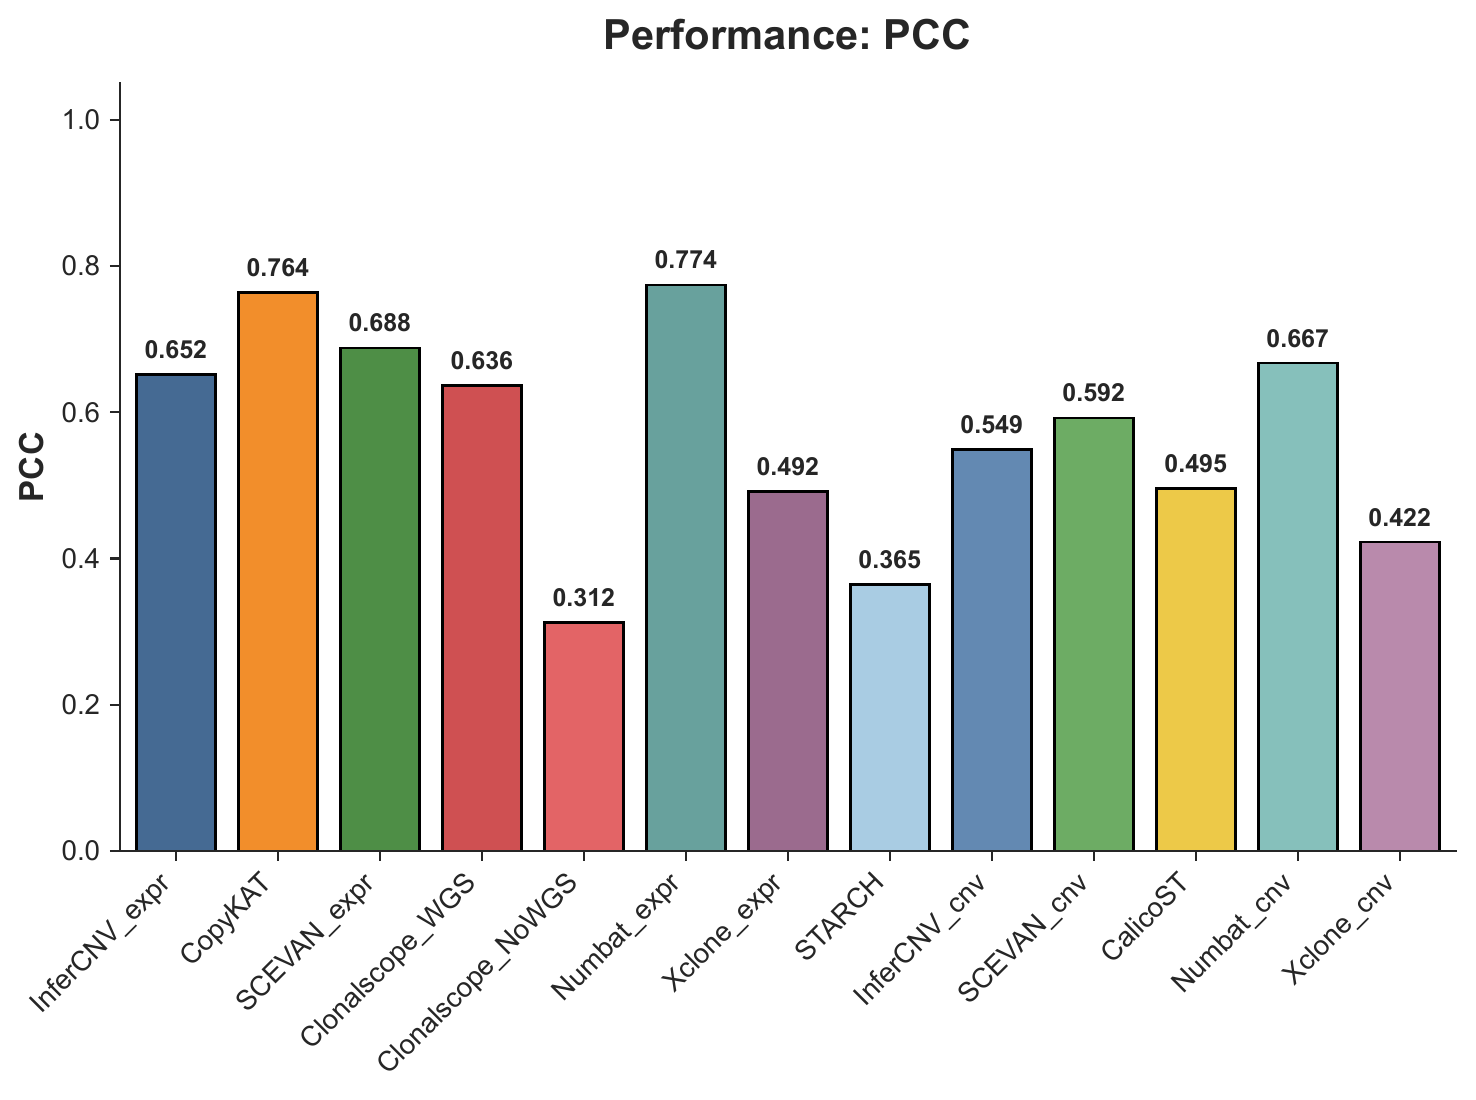
PCC Summary
This figure summarizes CNV-profile concordance using the Pearson correlation coefficient.
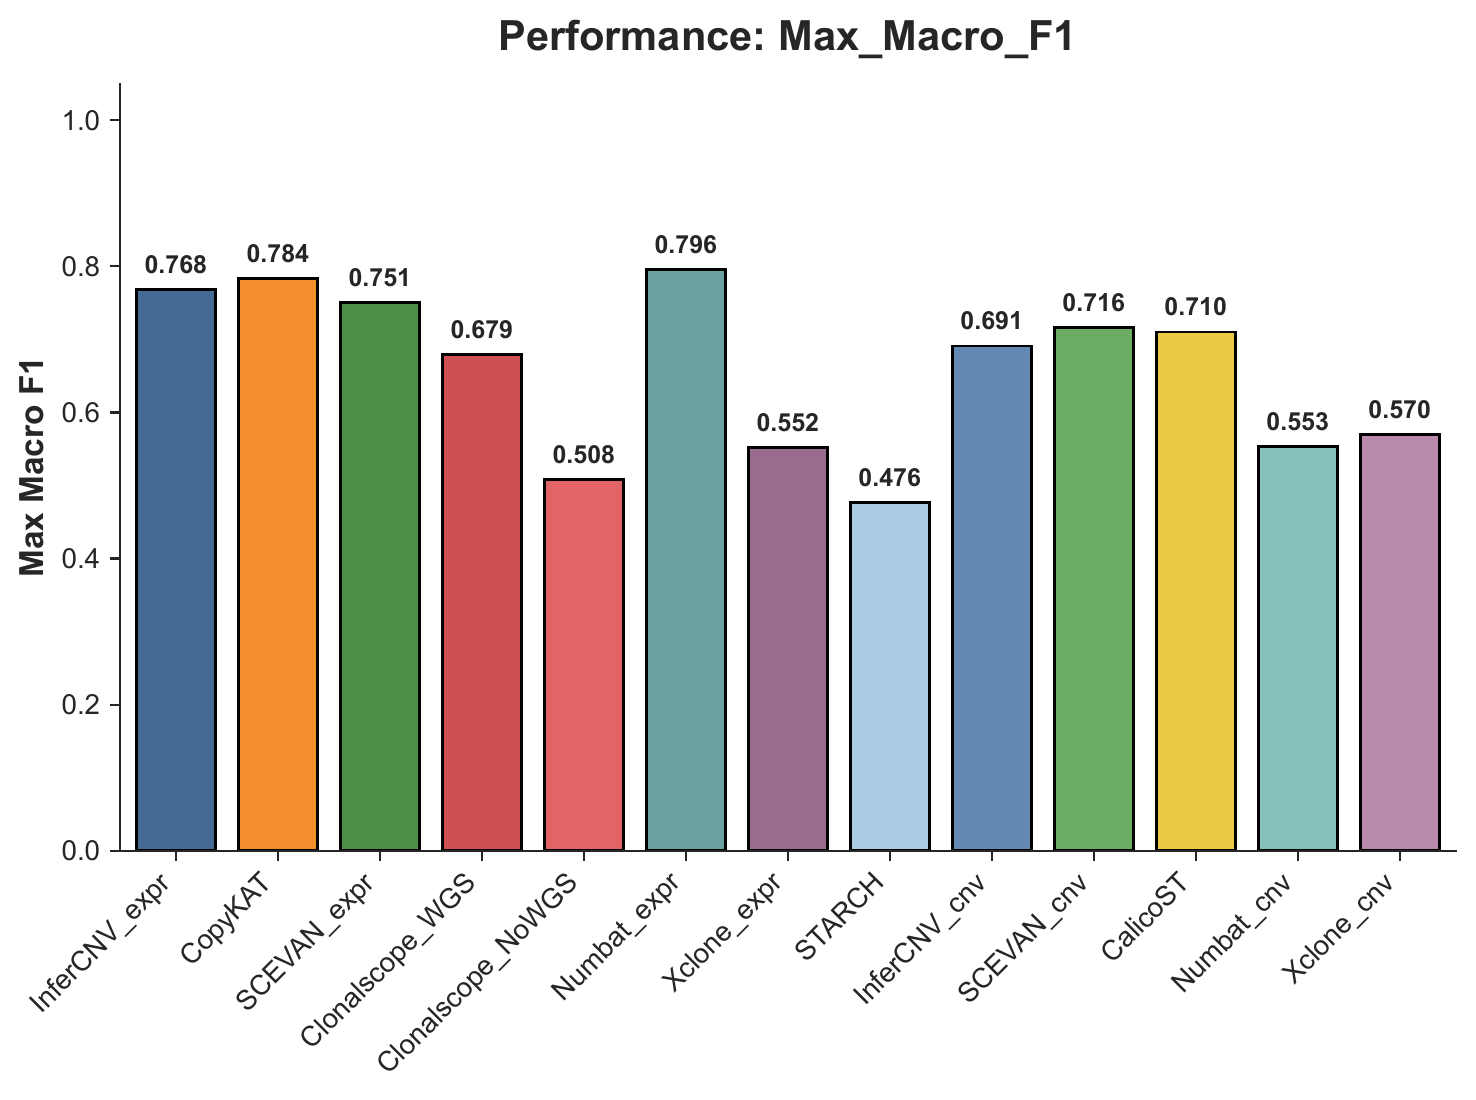
Max Macro F1 Summary
This figure summarizes discrete CNV-event agreement using the maximum macro F1 score.
Try Next
- For the packaged cSCC demo, go to Quickstart Demo And Expected Outputs
- For the tumor-normal task example, go to Tumor-Normal Classification Task Example
- For the subclone task example, go to Subclone Identification Task Example
- To adapt the workflow to your own data, go to Use Your Own Dataset