Subclone Identification Task Example
This tutorial shows how to run subclone identification on a paired Slide-DNA-seq and Slide-seq v2 dataset.
It uses SlideRNAseq_human_colon as the example dataset.
Data Source And Assumptions
The paired Slide-DNA-seq and Slide-seq v2 dataset is publicly available from the Sequence Read Archive under accession PRJNA768453.
Raw FASTQ files are processed through our upstream workflow, with the processing details described in the manuscript Methods section, and the resulting benchmark-ready package is then used as the input to ST-CNVBench.
In this tutorial, we assume:
- your
data.yamlcontains one dataset entry withdataset_id: SlideRNAseq_human_colon - the standardized input package is already available for that dataset
raw.subclone_gtis set to the paired Slide-DNA-seq subclone annotation used as the ground truthraw.cnv_gtis set to the clone-level CNV ground truth used for clonal CNV profile comparisonraw.beads_mappingis available when Slide-DNA-seq style pseudo-barcodes must be mapped back to original bead barcodes- your
models.yamlalready configures all benchmark methods that support subclone identification in this benchmark - your
eval.yamlfollows the same parameter structure asconfigs/templates/eval.template.yaml
For detailed config requirements, see Dataset Preparation, Model Run, and Evaluation.
Step 1: Prepare Data
Run:
st-cnvbench --steps prep \
  --data-config data.yaml \
  --prep-ids SlideRNAseq_human_colon
Check the prepared dataset under:
<output.root>/
Expected standardized outputs include:
filtered_feature_bc_matrix/filtered_feature_bc_matrix.h5adspatial/tissue_positions.csvspatial/scalefactors_json.json
Step 2: Run Models
Run all benchmark methods that support subclone identification:
st-cnvbench --steps run \
  --data-config data.yaml \
  --model-config models.yaml \
  --prep-ids SlideRNAseq_human_colon \
  --exec-mode conda
Check raw model outputs under:
<results_dir>/SlideRNAseq_human_colon/<model_name>/
Step 3: Evaluate Subclone Identification
Run in-slice subclone evaluation across all configured methods that support this task:
st-cnvbench --steps eval \
  --data-config data.yaml \
  --eval-config eval.yaml \
  --prep-ids SlideRNAseq_human_colon \
  --eval-tasks subclone_detection_in_slice
Check evaluation outputs under:
<eval_dir>/SlideRNAseq_human_colon/subclone_detection/
Typical outputs include:
- subclone prediction tables
- clone-level CNV profile comparison outputs
- spatial subclone visualization plots
- summary metrics tables
Example Results
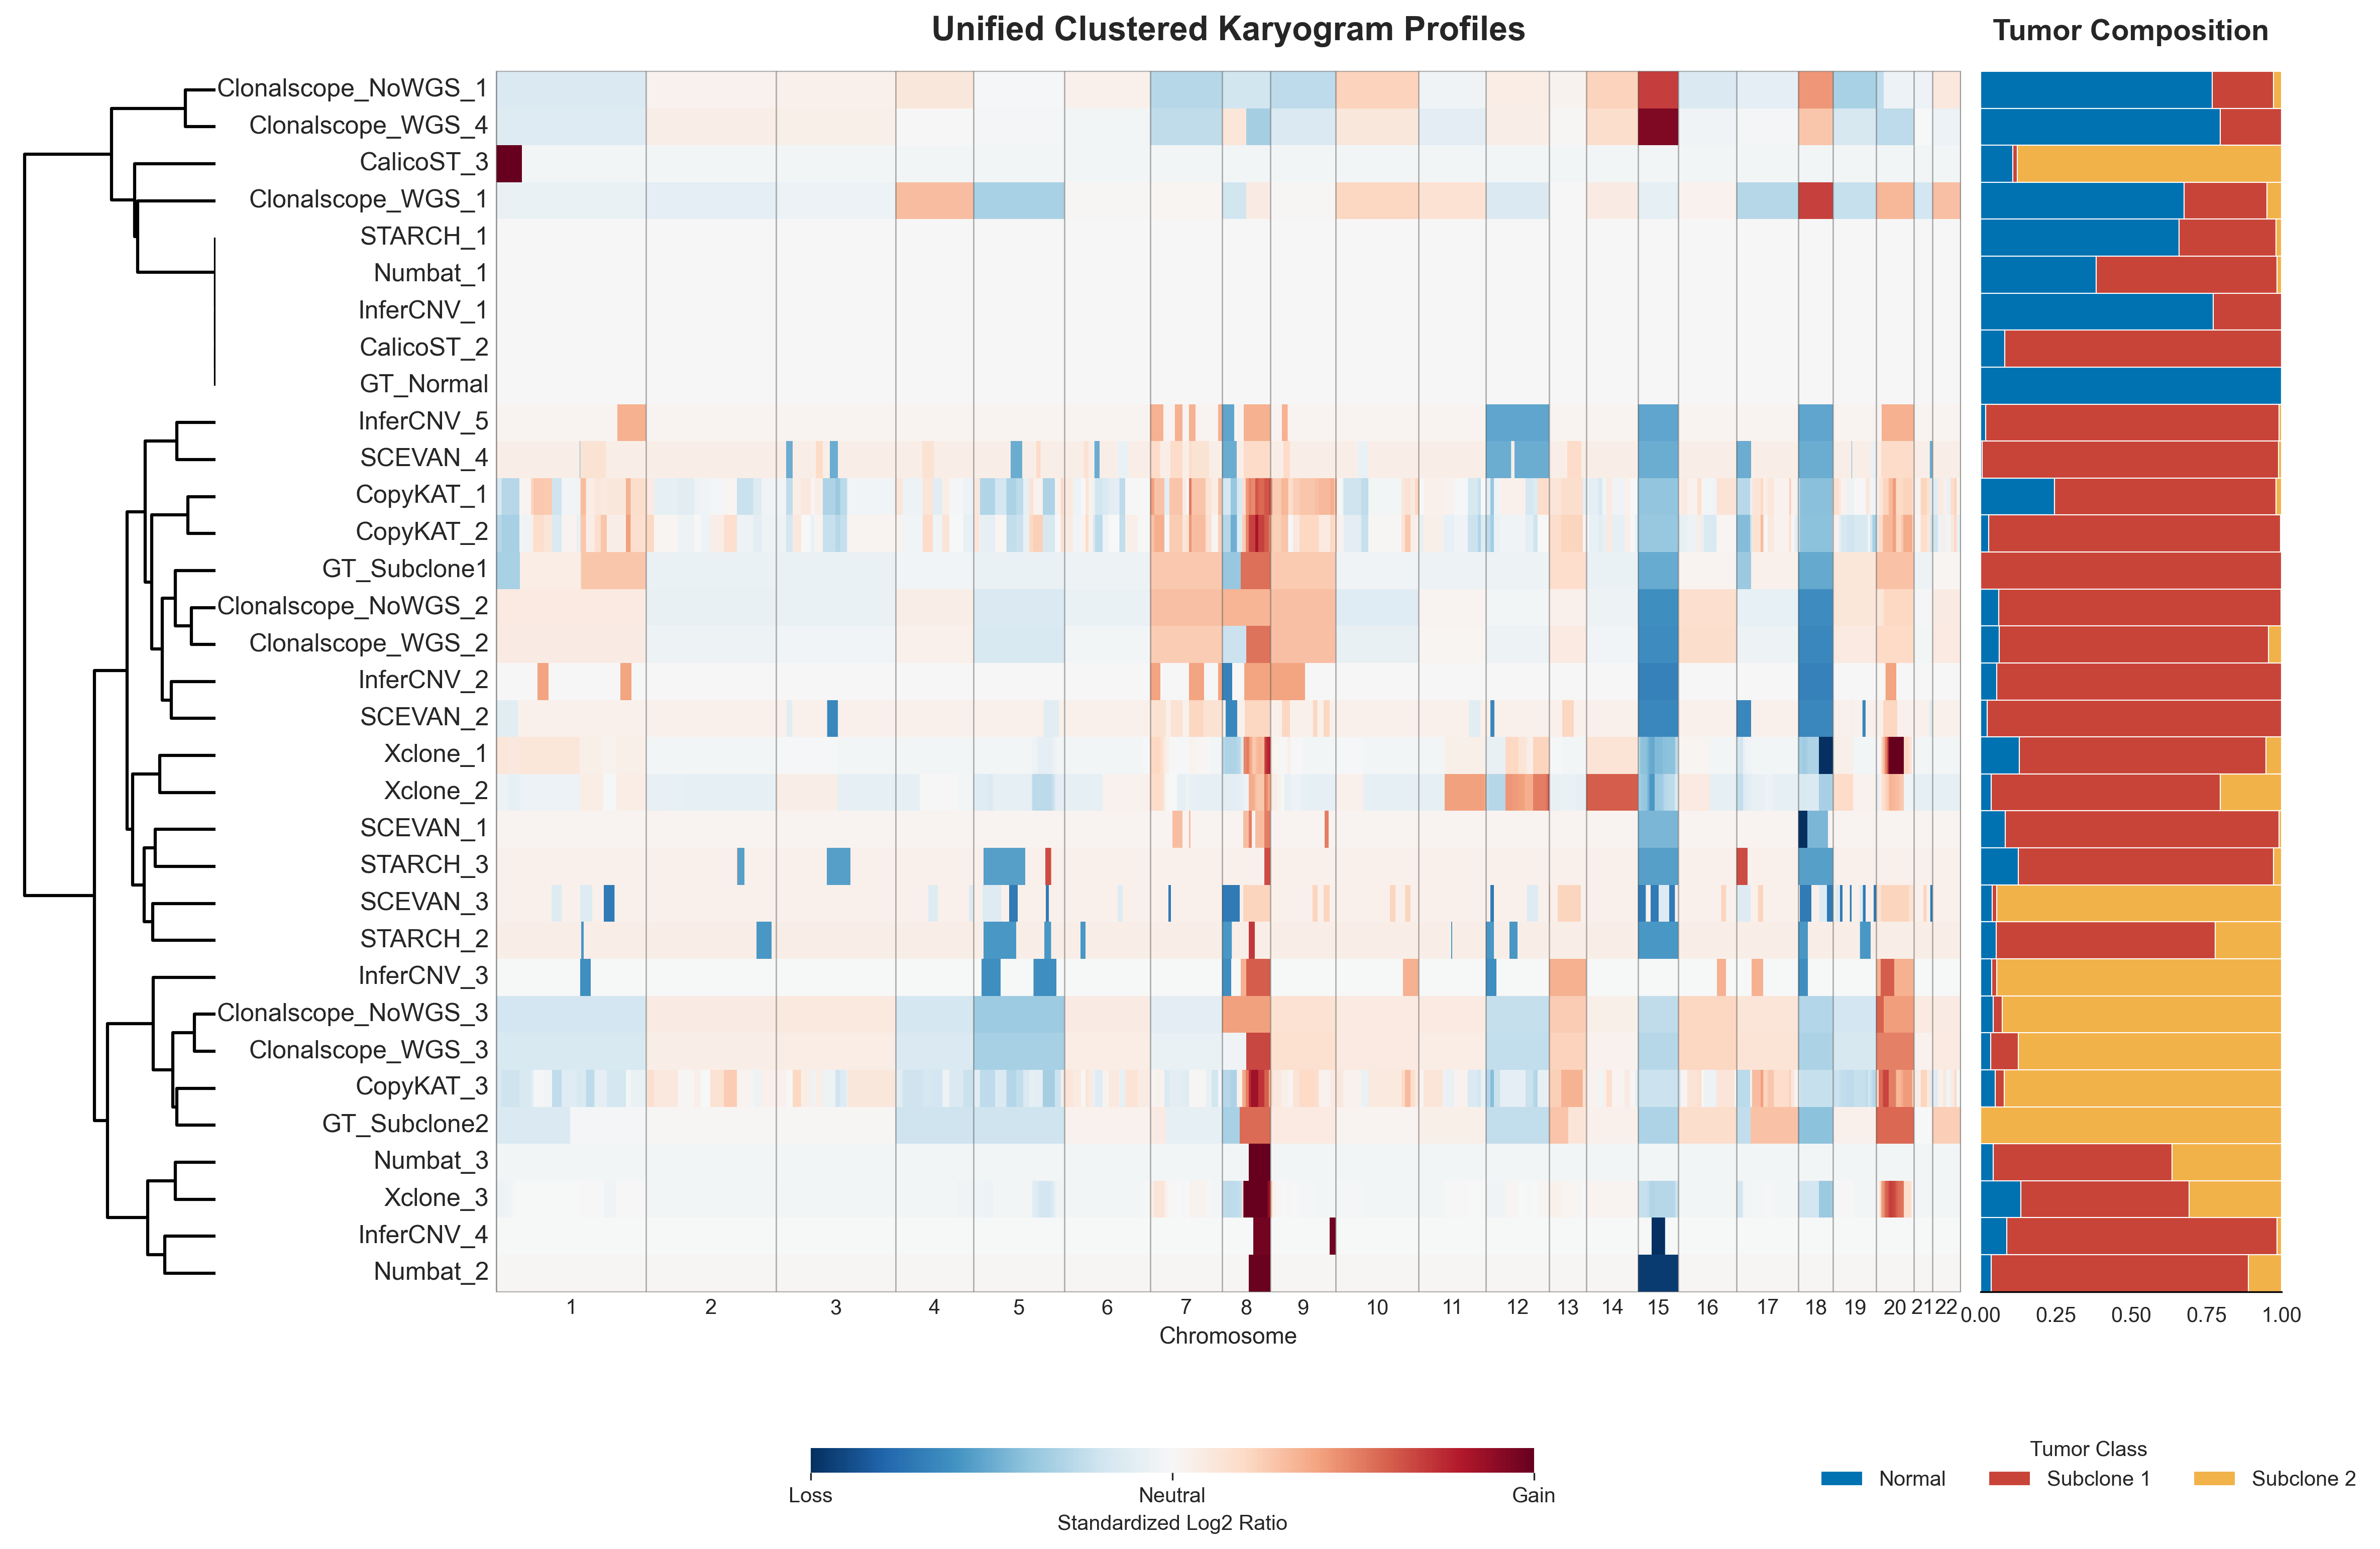
Clonal CNV Profile Karyogram
This figure shows the clustered clonal CNV profile karyogram across all methods.
For readability, the legend colors were adjusted in the final figure, while the default plotting palette is based on tab20.
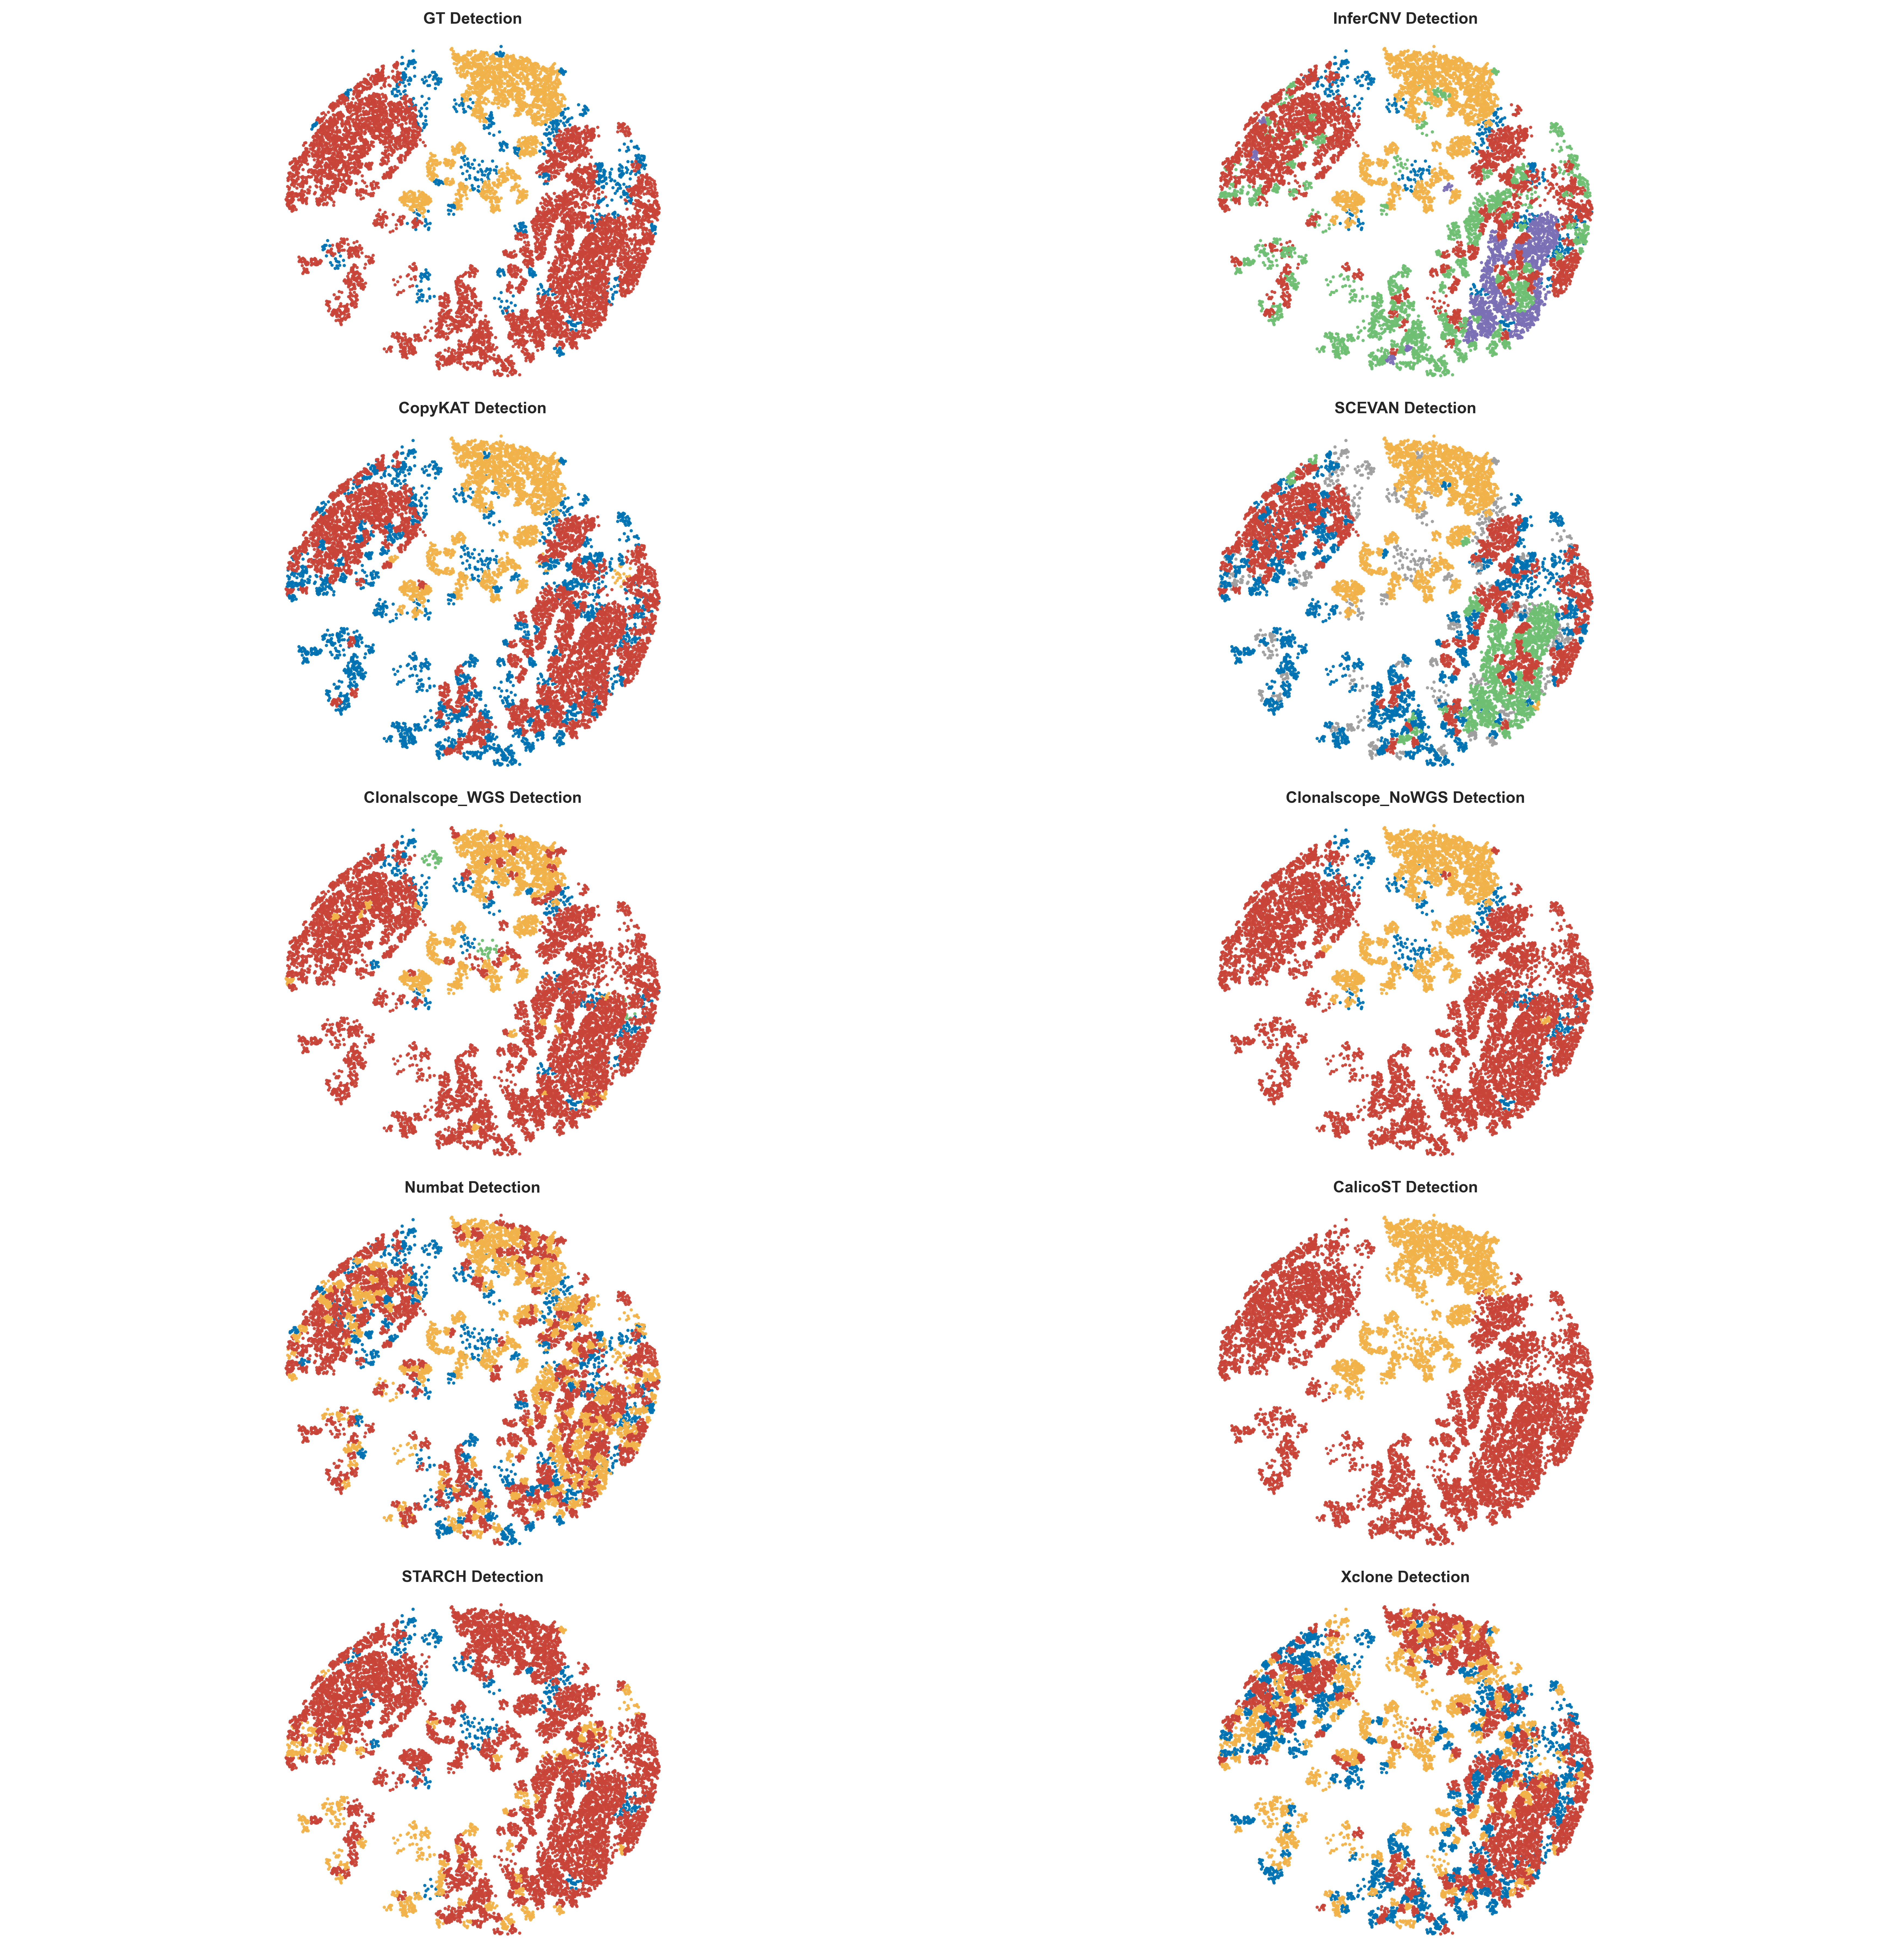
Spatial Subclone Visualization
This figure shows the spatial subclone predictions across methods.
For readability, the legend colors were adjusted in the final figure, while the default plotting palette is based on tab20.
Try Next
- For the packaged cSCC demo, go to Quickstart Demo And Expected Outputs
- For the CNV profile task example, go to CNV Profile Task Example
- For the tumor-normal task example, go to Tumor-Normal Classification Task Example
- To adapt the workflow to your own data, go to Use Your Own Dataset